
What are benchmarks?
Benchmarks let you compare your team’s performance against other engineering organizations. Weave calculates them from real data from the organizations that use the product, grouped into peer populations so the comparison is meaningful. You choose which population you are measured against: organizations of a similar size, organizations in your industry, or the rest of your own organization.How to configure benchmarks
In the top right corner of any page, click the settings icon to configure your benchmarks.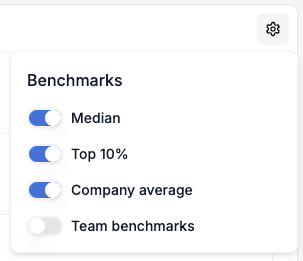
Peer groups
Organization size
The default. Most benchmarks are calculated separately for each size band, since team dynamics and performance characteristics vary significantly between small startups and large enterprises. A few metrics are compared against all organizations instead — see metric coverage.
Your organization is automatically placed in the appropriate bucket based on the number of engineers with at least one team membership.
Within your organization
Compare each person against the rest of your own organization rather than against other companies. Useful when your organization is unusual enough that external comparison is not the question you are asking.Industry
Opt in under Annotations to be compared against organizations in the same industry instead, at any size. A 30-engineer fintech is measured against other fintechs rather than against every 21-50 engineer organization. Weave assigns your industry automatically from your organization’s public profile. The two axes are alternatives, not a combination: an industry benchmark spans every size band.
Organizations whose software sells across every vertical are tagged horizontal and stay on the size axis. Their metrics are statistically indistinguishable from the population as a whole, so an industry line would carry no extra signal.
Privacy floor
An industry benchmark is only published when the peer group is large enough that no single organization can be identified from it:- At least 5 organizations in the industry, and
- Each contributing organization has at least 10 engineers
Suppression is per metric, not per industry. If your industry has enough peers
for code output but not for code review quality, the first is an industry
comparison and the second falls back to your size bucket. Every percentile and
benchmark line in the product names the population it was actually calculated
over, so the two are never presented as the same thing.
Benchmark types
Percentile benchmarks
Percentile benchmarks show how your metrics compare to your peer group:- Median (50th percentile): The middle value - half of organizations perform better, half perform worse
- Top 10% (90th percentile): High-performing organizations - only 10% of organizations perform better
- Top 1% (99th percentile): The strongest organizations in the peer group
Organizational benchmarks
These benchmarks compare your performance to other reference points inside your own organization, and are unaffected by your peer group setting:- Company average: Your organization’s overall average performance
- Company median: The median across engineers in your organization (less skewed by top performers than the average)
- Team average: Your team’s average performance (when available)
Metric coverage
Most benchmarked metrics are calculated per size bucket, and most of those also have an industry comparison. Four metrics do not yet have enough data to segment meaningfully, so they are compared against all organizations at once rather than against a size or industry peer group.
A metric with no industry row falls back to its size comparison, and says so. The four all-organization metrics are unaffected by your peer group setting.
How benchmarks are calculated
Data collection
- Time period: 180 days of historical data
- Refresh: recalculated on the 1st and 15th of each month
- Data sources: Real metrics from engineering organizations using Weave
- Filtering: Only includes non-generated (human-written) code and PRs
Scaling by context
Benchmark values are automatically scaled based on how you’re viewing the data:- Individual/Account view: Shows per-person benchmarks
- Team view: Scales benchmarks by average team size
- Organization view: Scales benchmarks by total organization size